Analyze, Plan, Play it right! If better is possible, good is never enough!
We are a team of data scientists, researchers and software engineers passionate about building solutions. We provide a variety of products and services to help get most out of data in all its stages. The aim is to empower executives and companies achieve their goals efficiently, timely and with confidence.
❝
To look is one thing, to see what you look at is another, to understand what you see is a third, to learn from what you understand is still something else, but to act on what you learn is all that really matters!
How do I act?
~ Unknown, Source (It is said Prof. Khun Pra Charoen Widsawakum)
Explore & Discover
There are a lot of tools out there that can help you explore data. The discovery of insights can be achieved using proper tools on healthy data.
Data comes from various sources: data entry, machine generated, extracted, downloaded or purchased. Data has to be checked, cleansed, transformed, validated, integrated and stored. Setting clear business goals is paramount in picking the right sources of data. Over 80% of the data science project is spent on making the data fit for modeling.
Understand & Optimize
After understanding the discoveries, proper planning helps achieve optimization.
Data has to be viewed from a variety of angles. Understanding the data is key to optimizing the methods in acquiring it. This is achieved by implementing impeccable cleansing and enriching procedures. According to Gartner, more than 85% of data science projects fail and mainly related to unfit data.
Automate & Expand
Once optimized methods are in place, automation aids in getting needed insights at a faster rate.
Automation removes the mundane and time-consuming tasks by 90% and eliminates human error. It also helps you to deliver insights on time and with confidence. The company at this point expands and the cycle continues with the sources of data.
PRODUCTS
PRODUCTS
We have vast experience in statistics, market research, media planning, media ratings, media spends, advertising performance, social media analytics, mystery shopping, accounting/ERP and dashboarding. Our solutions range from scripts to flagship products used in global companies.
We proudly present Abacus and QuickTabs.
ABACUS
A cloud based account/ERP system with a powerful search engine and plenty of deep analytics to run a company in an easy, fun and efficient way.
QUICKTABS
A great tool for researchers, marketers and students to explore and report on survey/row data using very advanced statistics and interactive reports without having knowledge in market research nor statistics
20+
Years of Experience
30+
Solutions
20+
Clients
35+
Countries
SERVICES
SERVICES
We offer a range of services to help companies achieve the insights they need in a timely fashion.
Consultancy & Training
Ranging from data handling to software design
Online Sessions
In Person
Data Handling
Provide guidelines or scripts to handle the following:
Data Extraction and Import
Data Cleansing and Governance
Data Transformation and Conversion
Data Processing and Validation
Data Exploration and Analysis
Data Integration and Mining
Data Reporting and Visualization
Custom Applications: Dashboards and Report Generators
Build full solutions:
Create Dashboards from scratch or use 3rd party tools like Qlik, Tableau, Power BI and others
Integration with R, Python or custom made algorithms (black-box)
Build automaticaly generated captions in plain English to summarize insights
Deep Analytics using Machine Learning, Market Research (Quantum), Statistics
Automated Report Generators in Formatted Text (HTML), Word (DOCX), Excel (XLSX), PowerPoint (PPTX)
Data Science
We provide technical expertise and via our business partners provide business and management consultancy in:
Exploring Data
Build Models
Implement Solutions
Validate Results
A Capgemini Survey: Leading causes of Big Data Mining project failures (technical reasons only):
Scattered Data with Various Teams
46%
Dependence on Legacy Systems
31%
Lack of Analytical Skills
25%
Lack of Clarity in Tools and Technology
22%
Cost of Tools in Implementing
18%
Data Security and Privacy Concerns
15%
CASE STUDIES
CASE STUDIES
Some examples of our projects showing challenges, solutions and results. Click on the module name to expand details.
Request
Our team was subcontracted by a regional market research company to design a desktop and online dashboarding powered with automated reporting and presentation preparation tool.
Challenge
One presentation took 4 researchers 36 hours to generate using PowerPoint, Excel and macros. They also needed to brand and stylize each report according to the fonts, colors and layout preferences of their clients and their clients' clients.
Solution
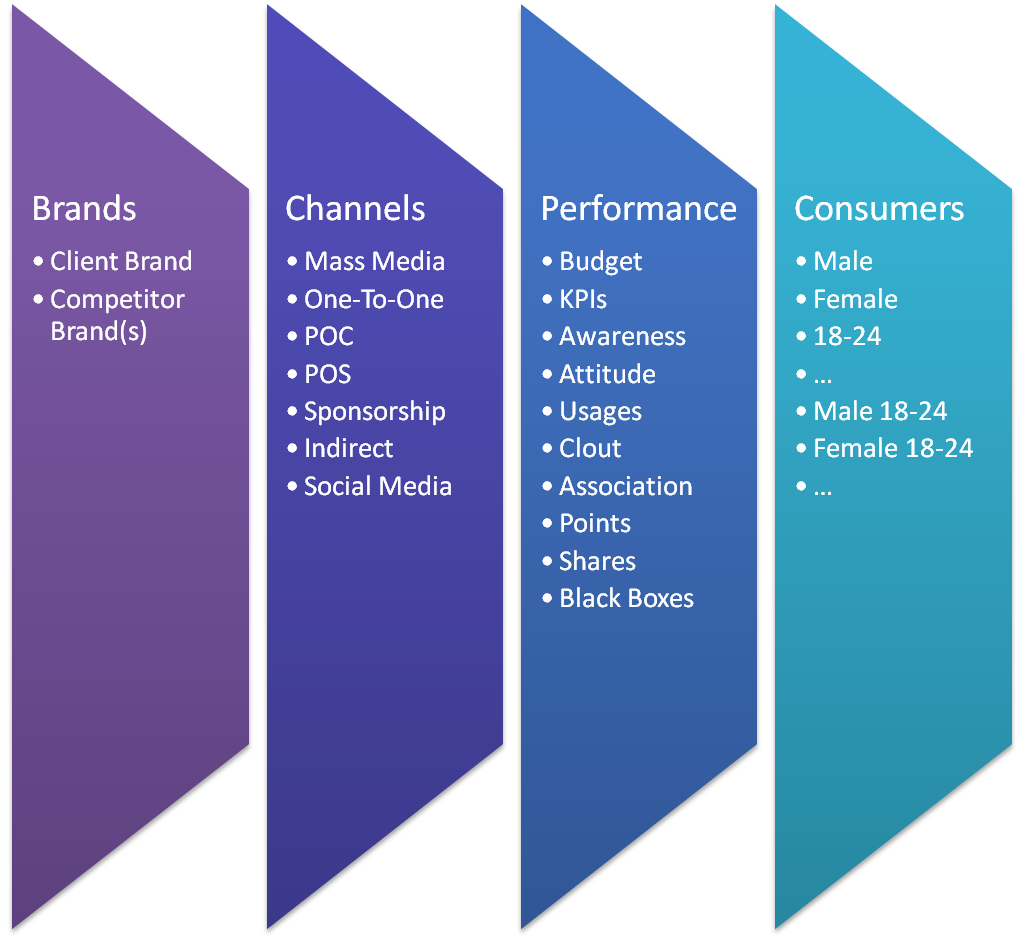
We designed an application to read data, parse it, calculate KPIs, analyze brands vs. competitors, generate tables and charts in PowerPoint templates of 200 slides. Each client had own branding preferences settings and reports selection. The user clicked on the Export button and only waited around 3-5 minutes for the whole presentation to be ready.
Results
During the first year, our client output progressed from generating 3 to 20 studies per month. In the second year the client was able to generate 50 studies per month and aiming to process 200 studies with the same team. The company expanded rapidly from serving regional clients to global clients within 2 years.
Request
C-Metriks was subcontracted to design an online mystery shopping platform for a global market research agency (Top 3).
Challenge
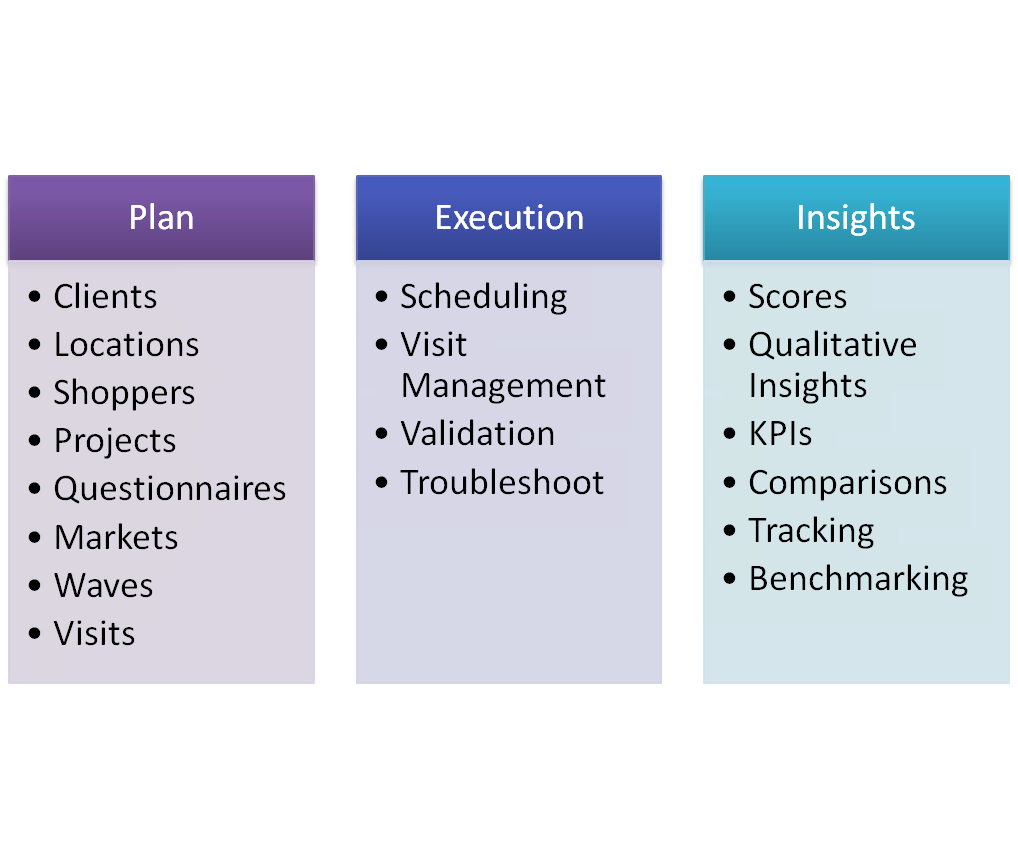
Researchers should be able to create and edit questionnaires on the fly according to client requests. Field Supervisors need to manage and monitor shoppers and visits. Shoppers receive instructions, visit the shops and then fill the questionnaire online. Researchers check the shoppers data entry, validate and translate. Clients log in to view the realtime reports online. There were complicated question types, tough scoring algorithms, customized reporting and huge number of shoppers and shops in countries like China for a single questionnaire. Moreover, the system had to be multilingual and it had a very detailed access privileges since each country operated using different procedures.
Solution
We successfully designed, implemented, integrated and optimized this platform because of our experience in MIS, Market Research and Dashboarding and this solution was completed and did not need programmers nor tech-savvy users to execute any part of it.
Results
During the first year, our client was using this application in 5 countries in the region and in less than 3 years, it was being used in 30+ countries. The software's interface had 7 languages available and each questionnaire could be read in an unlimited number of languages. The shopper was able to select a language and the client viewed the questionnaire and responses in a different language. Each country or group of countries had an admin to manage all the users within their reach.
Request
A regional television network needed a tool to generate TV ratings from Day-After-Recall surveys based on user-defined consumer segments.
Challenge
The television network had a database of 100s of channels and 10,000s of programs. These channels belonged to them or to their partners or to their competitors. The software needed to dig in respondent level data, do the calculations and generate tables and dashboards in matter of seconds. When they needed extra reports, they used to send the request to their research agency and it took up to 2 or 3 days to get the results.
Solution
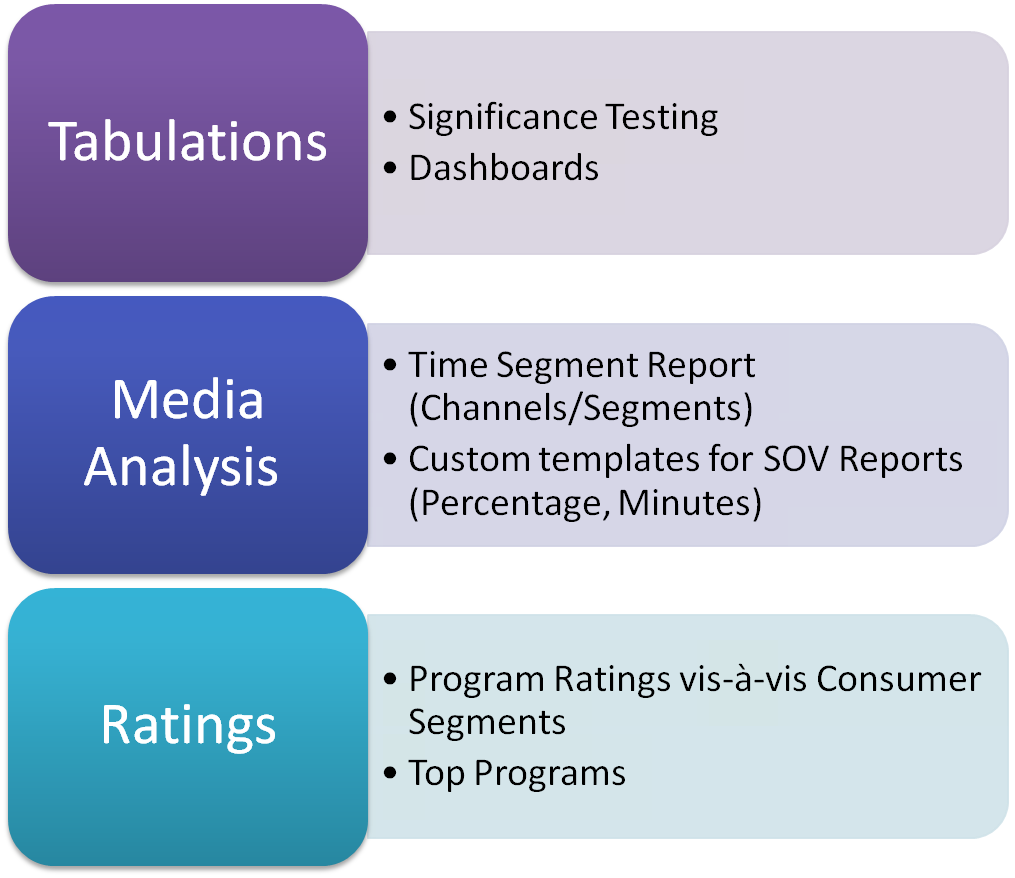
We created an add-on to the tabulation software QuickTabs. We kept optimizing the use of the media ratings reports so that no report took more than 3 seconds to generate for a 40 column table.
Results
The client was able to generate reports instantaneously and save settings for different markets and waves. At any time, the client could instantly compare their position vis-a-vis their competitors. Moreover, the user could select the type of analysis and coloring scheme of the tables to highlight the desired ranges of ratings and compare them to other consumer segments with ease.
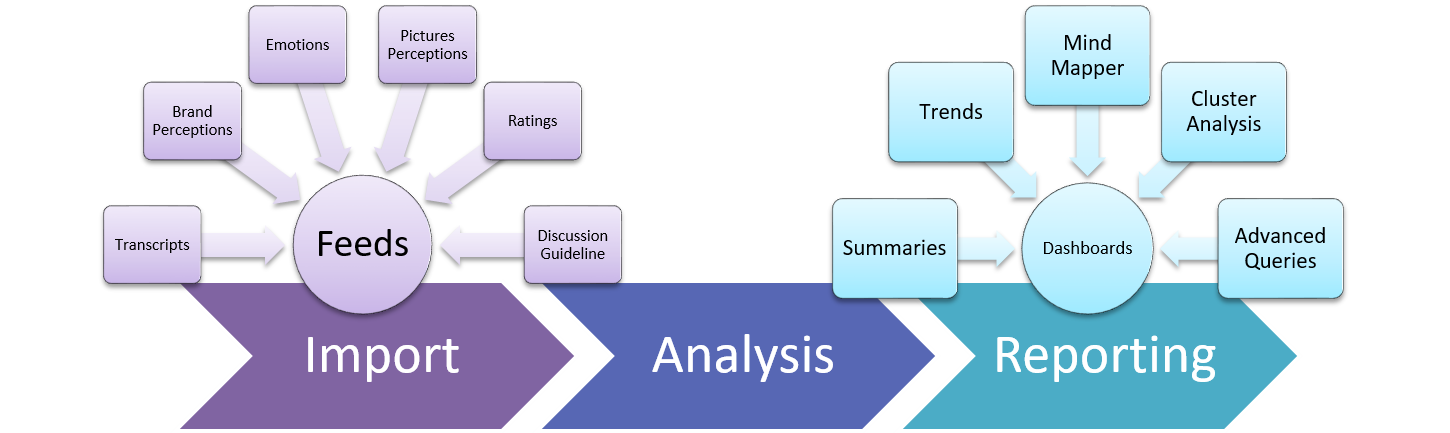
Request
A tool to analyze transcripts, Brand perceptions, Pictures perceptions, Ratings whether documented from Individual Interview or Focus Groups according to specific discussion guidelines and be able to report on 200 transcripts simultaneously.
Challenge
The transcripts could have delimiter problems and were done in different languages including Arabic which is an RT language.
Solution
We developed a tool called Insighter to import transcripts using special delimiters. The researcher created records of individuals or groups along with their samples and attached the corresponding transcript. The importing process took a few minutes to import all the text into the desktop application. The research was able to tag, select verbatim and easily write analyses and summaries based on demographic filters.
Results
The client was able to outperform competitors due to the large amount of input handled simultaneously and was able to perform trackers easily for all countries in the MENA region.
Request
C-Metriks was sought by a regional media agency to design a very challenging application that read from different sources so that the researcher took a few minutes to generate reports that used to take about 3 weeks to prepare manually if not containing human errors.
Challenge
Data are from three different sources. One supplier had a considerable amount of duplicates which affected the Top Mediums, Top Submediums lists. The data needed to be integrated and the items (brands, categories, mediums, countries, ...) from different sources did not match up.
Solution
We created an importer to the data that searched for duplicates using seven algorithms, prompted the user for action, remembered the settings and then continued to find the keys to match the other source of data. With time the software learned from the users the different challenges and there were less and less inputs from the users as to what was needed to be done regarding data cleansing and matching on subsequent uploads.
Results
The client was able to deliver reports in same day with all confidence and also provided online interactive dashboards to their clients.
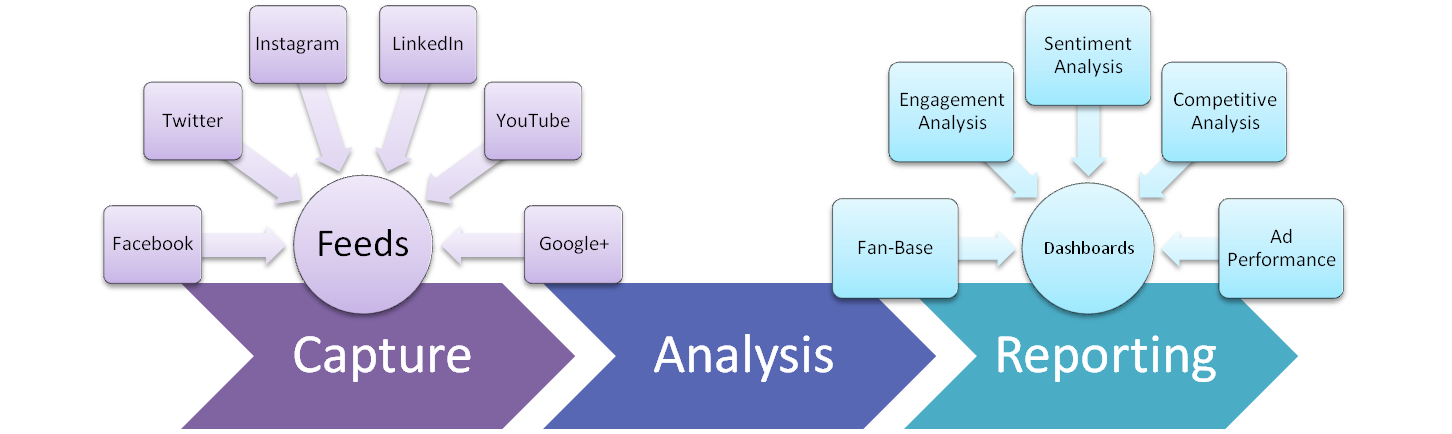
Request
The client needed a tool to analyze sentiments of Arabic speaking uses on various social media tools including: Facebook, Twitter, Instagram, YouTube, LinkedIn and Google+.
Challenge
Arabic is spoken differently among nationalities and expats. Automated sentiment analysis was not enough because it achieved only 60% accuracy. The work had to be done manually and it was too mundane.
Solution
SMART downloads all the posts, comments and engagement and using its intuitive algorithms, the researchers were able to flag and categorize the comments. The exact sentiment was tagged and valence calculated.
Results
The tool generates dashboards which helped advertisers what content to put, where and when. This resulted in 80% reduction in advertising to achieve the same results. The marketing teams of the clients were placing ads more confidently.
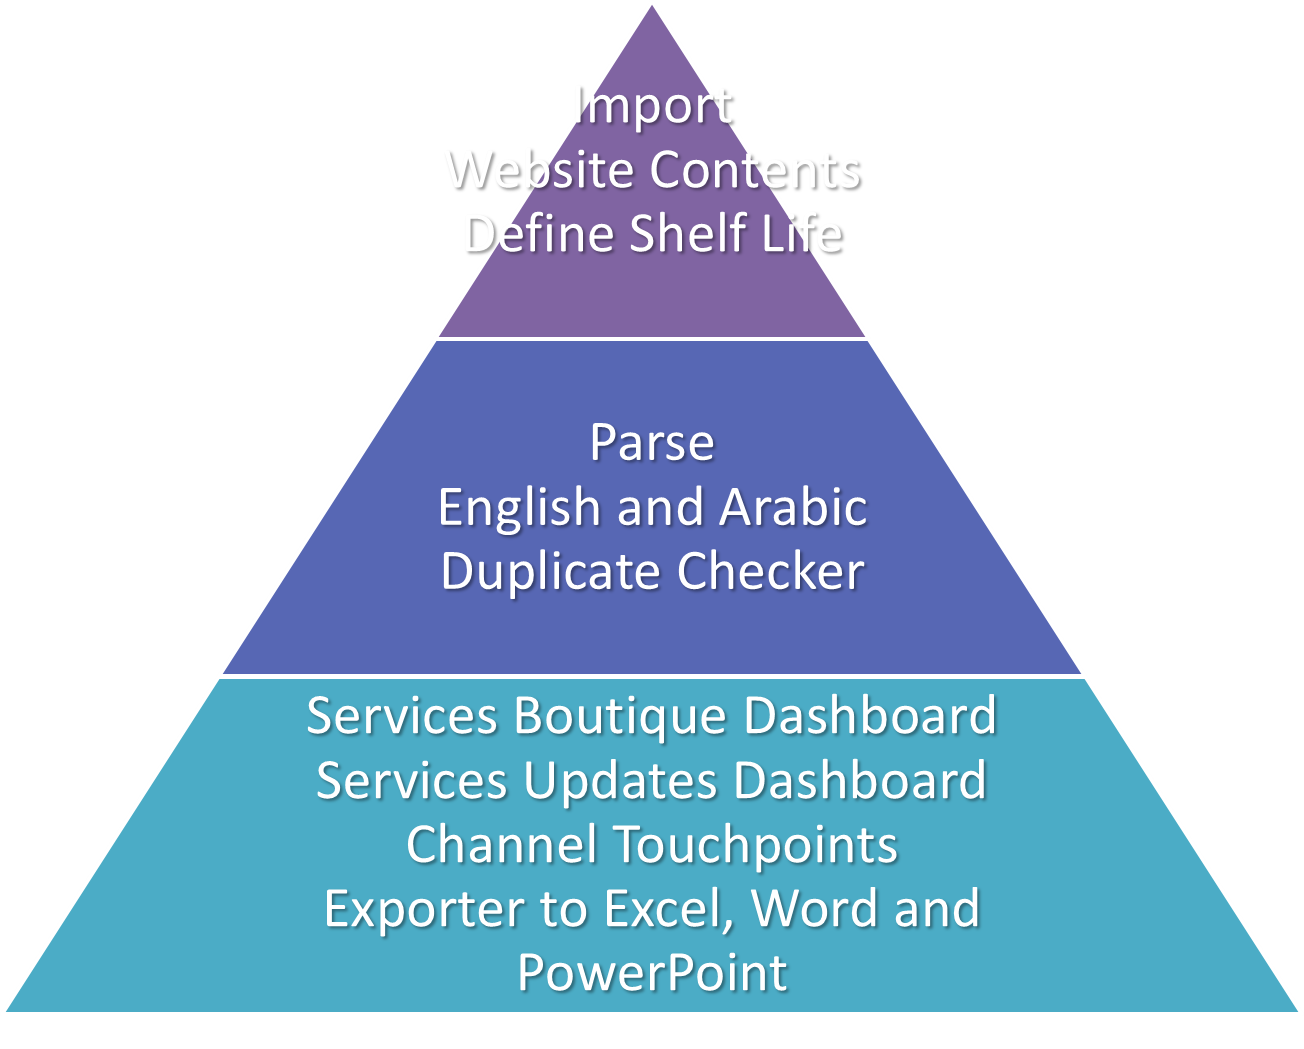
Request
The government has many departments and it needed a tool to dashboard its services, scheduling and people responsible using categorized filters and advanced text searching engine.
Challenge
The content management tool does not have multi-lingual support. Its reporting tools and data extracts were limited. The client was stuck with it because it had features that other content managing systems did not offer.
Solution
We built an importer to download data from an API engine and parse it separately for English and Arabic. The data is stored for many months in order to check on what has changed and what needs to be changed.
Results
The client is able to generate all reports and plan a weekly schedule without needing to go back to the Content Managers every time they needed the reports. Using the tool, they were able to supply their users with Excel Sheets and PowerPoint presentations with all the data needed to apply for a service.
Request
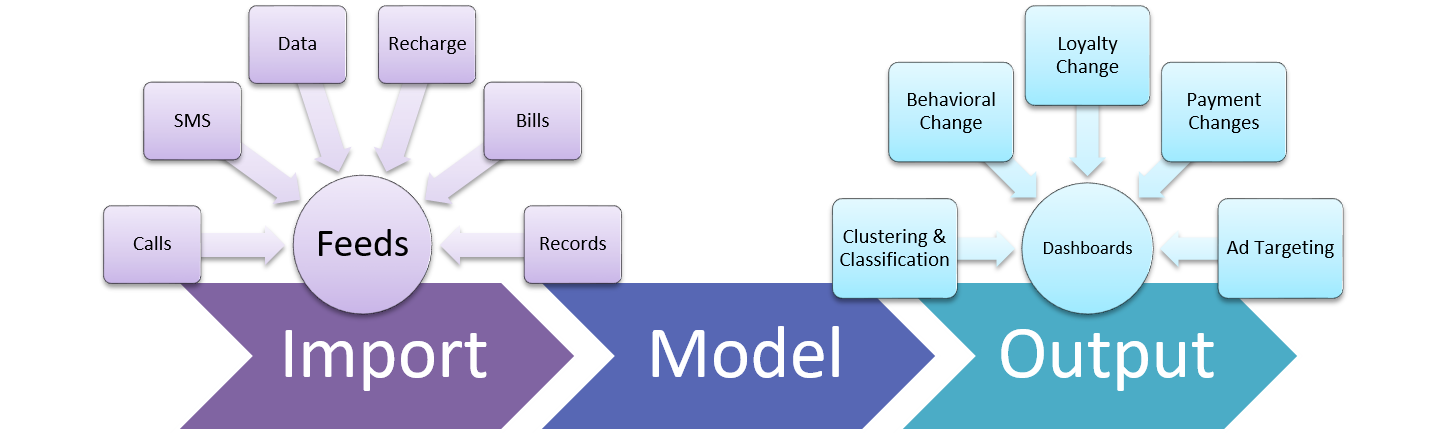
A Data Mining project coupled with Loyalty platform to cluster customers into 12-20 microsegments.
Challenge
The Calls, SMS data gave 3 clusters only due to unfit demographic data. The only way to solve the problem was to look at mobile data usage.
Solution
We wrote scripts to parse petabytes of data every month in order to classify users based on how they use the internet.
Results
The model was able to classify the customers and advise on targeting ads to move the customers to one of the 12-20 microsegments.
Request
The project consisted of many data mining exercises: Clustering, Classification, Purchase Variance Detection, Purchase Power Detection and Delinquency Detection.
Challenge
At first the data was not so fit for data mining. The IT department followed our recommendations and in 3 months managed to make the data healthy.
Solution
The clients were clustered based on their purchasing categories, frequency, amounts, loyalties and payment timing.
Results
The bank is cost effectively targeting their credit card clients with ads so the bank, the customer and the sponsor are all in a win-win-win situation. The account managers would get notices of possibile delinquency on payments with accuracy of 98%. Marketing managers have an overview on general populatin or individual or a certain demographic on purchasing behavior.
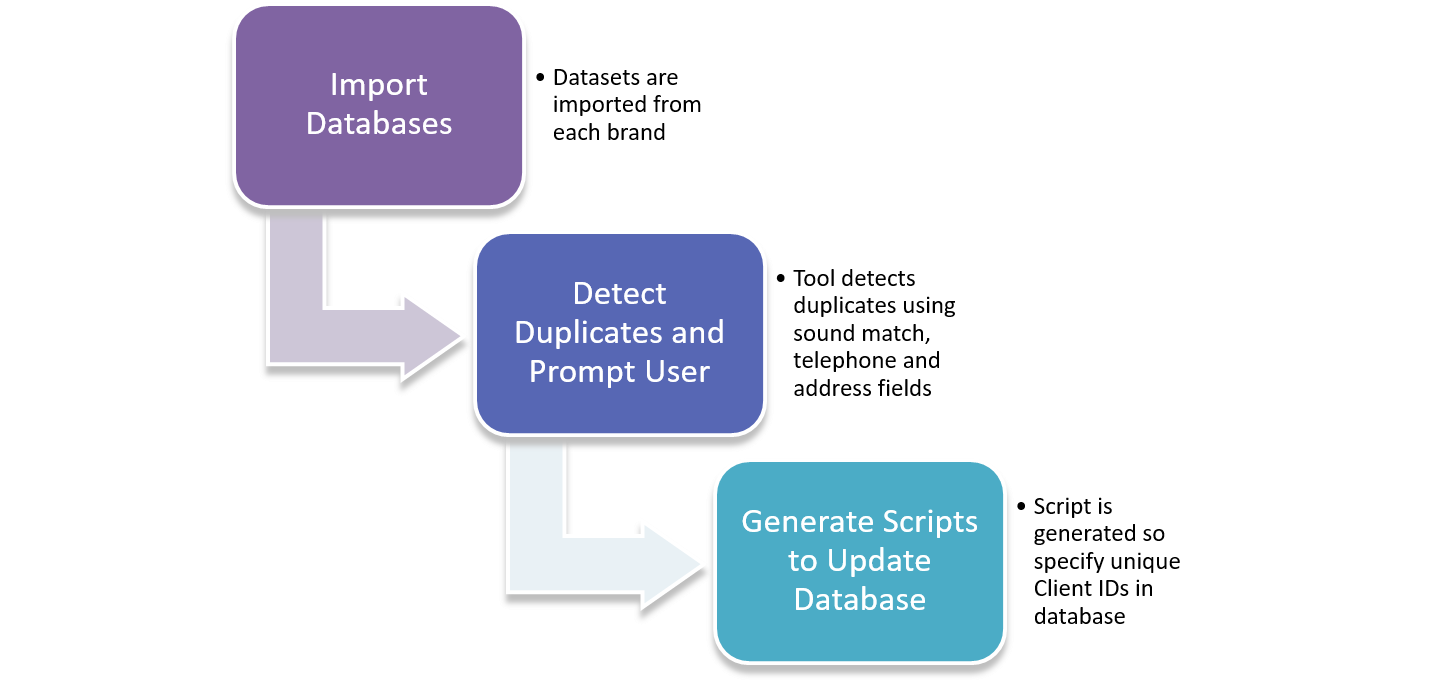
Request
A top retailer in the country was seeking to apply a data mining exercise to determine how to cross-sell and up-sell a client.
Challenge
The database had many duplicates due to lack of data governance, limitations in the software and lack of skills of the IT team. The data was also acquired from dozens of branches in the country and consolidated in one database.
Solution
The solution was to create a unique ID for each client and to find duplicate records using sound match on names, address and matching telephone fields.
Results
Cleansing and fitting process of the database was estimated to be completed within 3 to 6 months.